Windows Kernel Debugging: Basics
Perhaps you have ever wondered if it is possible and whether it is worth debugging not a single program but all that is under the control of the operating system? If the answer is ‘yes’ or I have just aroused your curiosity, make yourself a coffee or tea and read the paper that I have prepared for you.
1. Introduction
The aim of this paper is to familiarize you with the preparation of the environment for debugging the Windows Kernel, to explain you pros and cons of possible solutions of and to guide you through Windows Kernel Debugging Environment Setup.
2. Why does anybody may need kernel debugger?
Kernel debugging is necessary to solve a large number of problems associated with kernel mode problems:
- reading/writing a kernel mode address space,
- developing a kernel mode driver,
- kernel mode malware analysis.
3. Environment
If you are still interested in taking control over a whole Windows machine or you are desperate to change the way you think about Windows Internals, you have to be aware of a few changes in relation to ‘traditional’ user mode debugging. Firstly, you will gain access to any resource in the system: from CPU through whole memory to threads. Secondly, every breakpoint you set will halt the system. Therefore, you need a second machine. A physical environment is versatile, however, you may not be ready for extra expenses. An alternative solution is to use a virtual machine or… virtualization of the entire environment.
3.1 Physical environment
To set up a physical environment you need two machines: a host (debugger) and a debug target (debugee). There is no specified reason to have a common OS version and architecture. However, you need the same connection type between these machines. Supported ones are: Ethernet, Serial, IEEE 1394 (FireWire) and USB (2+). A table below show pros and cons of possible solutions.
| Interface | Reliability | Speed | Additional info |
|---|---|---|---|
| Ethernet | Stable | Fast | Requires Ethernet firmware support |
| Serial | Most reliable | Very slow | Enables very low level debugging, eg. system level power management or Windows loader; may be not available with modern PCs |
| IEEE 1394 | Most reliable | Fast | Could be used via add-on cards |
| USB | Moderate | Fast | Requires special cable |
There are some remarks related to connection types. USB 2.0 usage is allowed if only it’s a port no. 1. It’s also necessary to use a crossed-over USB cable. If you’ve taken decision to use Ethernet, you should check if your NIC is supported.
If physical connection type has been chosen, just connect two machines by it.
3.2 Virtual environment
Debugging virtual machine is much more cheaper than maintenance of additional physical devices. Naturally, a physical host is not needed to be Windows-driven. The multi-purpose solution is connecting guests (debugger and debuggee) by virtual network connection.
There are some environmental assumptions in a context of this example solution:
- host is a Linux-driven machine with VirtualBox as a hypervisor,
- debugger is Windows 10 VM,
- debuggee is Windows 10 VM,
- debugger and debuggee are connected via virtual NIC.
If you will have any problems with connection between machines while following this solution, please be sure that your NIC is supported.
The next part of this paper shows virtual environment setup.
4. Virtual Environment Setup
4.1. Prepare target machine (debuggee)
If you have already set any network connection up, it is the time to prepare a debuggee.
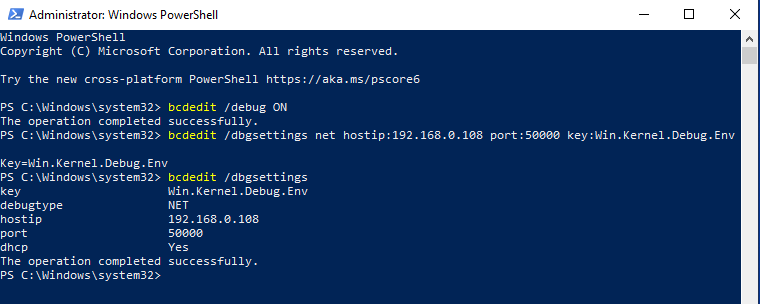
As administrator, run the commands using debugger IP address:
bcdedit /debug ON
bcdedit /dbgsettings net hostip:192.168.0.108 port:50000 key:Win.Kernel.Debug.Env
You can inspect this config later by running a command:
bcdedit /dbgsettings
4.2. Prepare host machine (debugger)
Download & install Windows 10 SDK .
All tools should be stored in
C:\Program Files (x86)\Windows Kits\10\Debuggers\x64\directory.Create symbols cache directory, e.g.
C:\Symbols.Export _NT_SYMBOL_PATH environmental variable:
setx _NT_SYMBOL_PATH "srv*C:\Symbols*https://msdl.microsoft.com/download/symbols"
4.3. Start debugging kernel
Actions below should be taken on debugger as long as there is no other prompt.
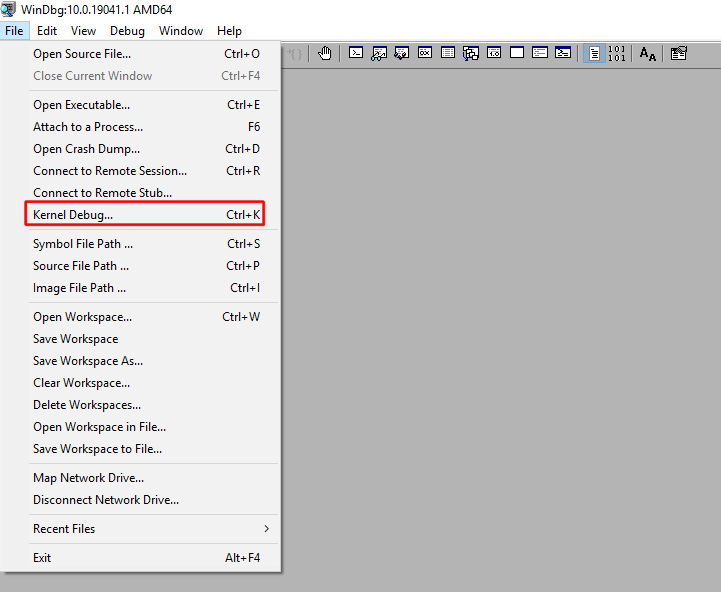
Launch WinDBG located at
C:\Program Files (x86)\Windows Kits\10\Debuggers\x64\windbg.exe.Select ‘Kernel Debug…’ from File menu.
- In a ‘NET’ tab set a key as ‘Win.Kernel.Debug.Env’.
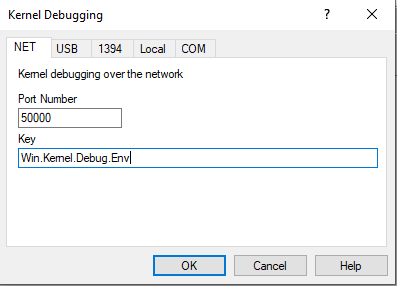
- Press OK.
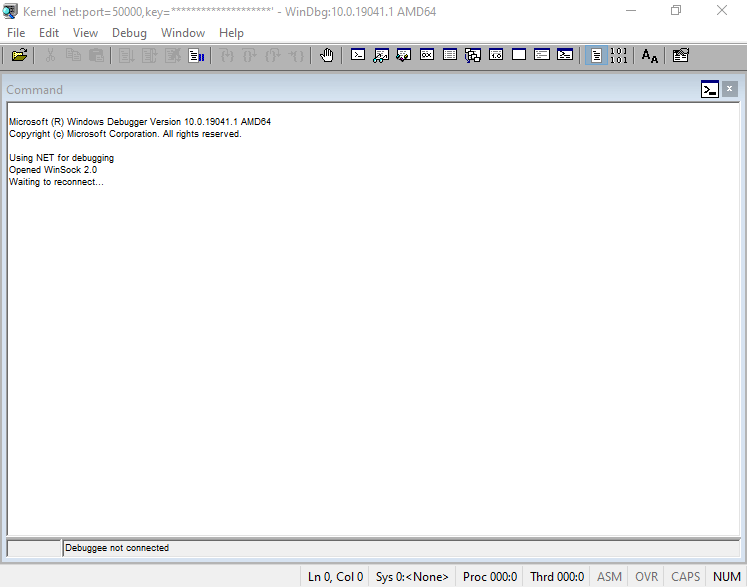
Restart debuggee now and wait.
After few seconds you should see:
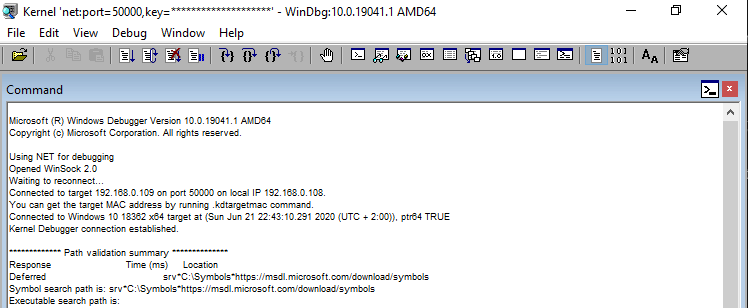
At this point, you should be able to effectively test kernel debugging capabilities.
4.4. Test
In WinDBG select Break from Debug menu or just press Ctrl+B.
Try to run any command in windbg session, e.g. list all processes:
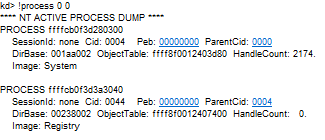
!process 0 0
If you can see listing as below, everything is OK.
Otherwise, if you will have any problem with symbols, e.g.:
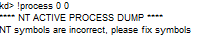
you can repair symbols by running commands in windbg session:
.symfix
.sympath
5. Summary
This paper explains reasons and prerequisites for configuration an own Windows Kernel Debugging Environment. In addition, the advantages and disadvantages of acceptable configurations are presented. Finally, the last part of the paper is a step-by-step guide that helps to prepare an instance of virtual environment. The proposed solution is based on two Windows 10 virtual machines that were embedded on a physical Linux machine and were connected via a virtual network.
The next paper on debugging the Windows Kernel will describe selected windbg commands and possible ways to use them.