Windows Kernel Debugging: Crash dump
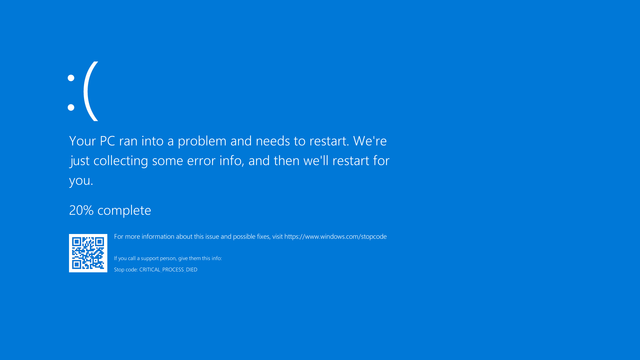
What to do if you see the Blue Screen of Death again? Microsoft’s statistics indicate that at least 70% of blue screen instances are caused by incorrect driver implementation. Unfortunately, the flawless implementation of the operating system kernel module is a difficult and responsible task. If you have ever wanted to look under the hood of the Windows operating system, identify a problematic driver or are looking for a rootkit hiding in kernel space, I invite you to read the article.
1. Introduction
In the Windows operating system there is an implementation of the mechanism that dumps memory into file. The article presents specific properties of individual types of memory dump files. In addition, ways of configuring the mechanism for performing memory dumps and triggering the operation of this mechanism are indicated. The last part presents an example that guides an user of the Windows operating system through the steps of basic analysis of a memory dump. As a result of the analysis, the operating system module was identified and the path to the executable file from which the module is loaded was revealed.
2. Memory dump file
Memory dump file (aka crash dump) is a snapshot of the operating system state at the time this dump was taken. Contains saved processor context and content of physical memory.
The types of memory dumps include:
full (or complete) dump - contains a complete snapshot of all available physical memory space; for 32-bit operating systems with at least 2 GB of RAM, it is not possible to make such a dump;
kernel dump - snapshot of physical memory space that has been reserved for the operating system kernel;
minidump - contains the smallest dataset: a stop code, a list of loaded drivers, a kernel mode call stack for a stopped thread, a structure of that thread and a structure of a process to which this thread belonged; this type of dump is not suitable to perform detailed analysis, but it may be the only type of dump that can be made due to the very small free space of the non-volatile memory;
automatic dump - this is a variant of a full dump; during its creation, the operating system has the ability to adjust the size of the swap file; useful in environments equipped with SSD disk(s) and a large amount of RAM;
active dump - this is a filtered out and smaller-sized variant of full dump; the active dump does not contain memory pages that are usually not needed during analysis; there will be a lack of free and zeroed pages and pages associated with virtual machines; useful when the environment under analysis is a host for virtual machines.
3. Managing memory dump creation
The Windows administrator has the right to manage the mechanism responsible for creating memory dumps. He can use his permissions in several ways, the most convenient methods are:
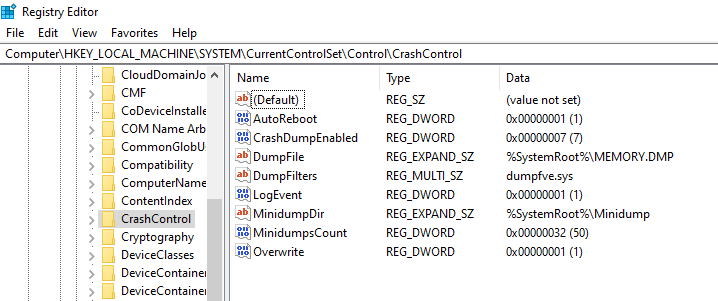
- editing the content of the key
HKEY_LOCAL_MACHINE\SYSTEM\CurrentControlSet\Control\CrashControlin the Windows registry
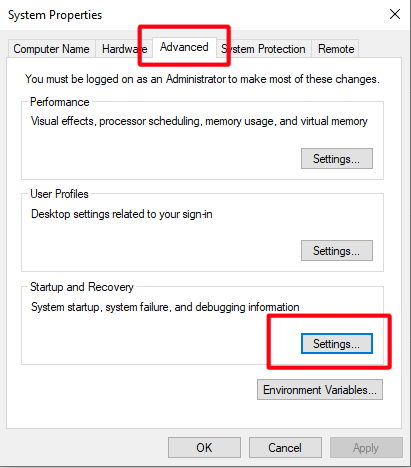
configuration in the
Startup and Recoverywindow:- Run the command:
sysdm.cpl - In the
System Propertieswindow, in theAdvancedtab, in theStartup and Recoverysection, select theSettings...button:
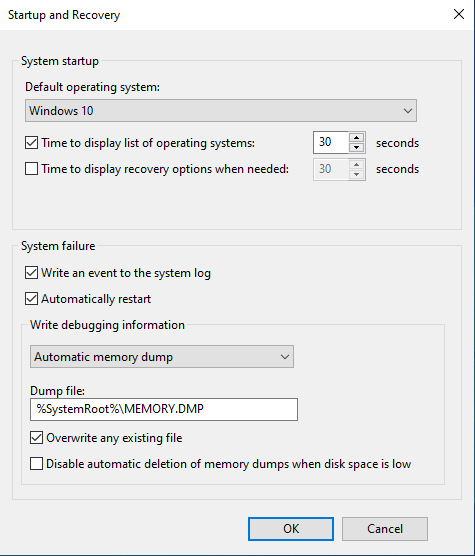
- The
Startup and Recoverywindow will appear in which you can enter your own configuration:
- Run the command:
4. Performing a memory dump
4.1 Dump initiated manually
The memory dump takes place as a result of entering a key combination [Key 1] + [Key 2] + [Key 2]
To configure this method of performing a memory dump:
Run Device Manager or the command
devmgmt.mscFind the keyboard you are using and launch the Properties window.
Then, in the
Drivertab, selectDriver Details
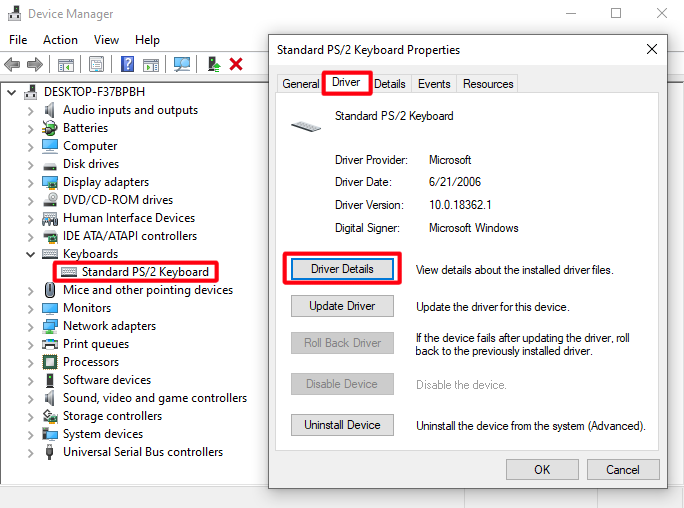
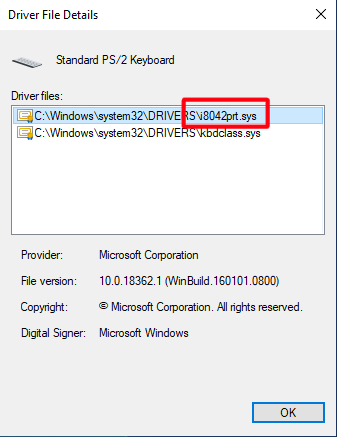
- In the
Driver File Detailswindow, read the name of the keyboard driver, e.g.i8042prt
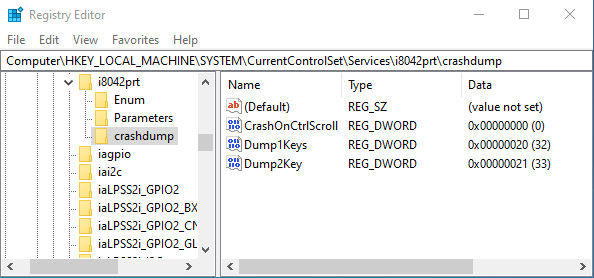
Run the Registry Editor or the command
regeditCreate a key
HKEY_LOCAL_MACHINE\SYSTEM\CurrentControlSet\Services\{NAZWA_STEROWNIKA}\crashdump
e.g.:
HKEY_LOCAL_MACHINE\SYSTEM\CurrentControlSet\Services\i8042prt\crashdump
- Add three 32-bit DWORD values to the key you created:
CrashOnCtrlScroll   : 0x00
Dump1Keys           : 0x20
Dump2Key            : 0x21
- Restart the machine
After pressing the key combination Left Ctrl + d + d the BSOD will be displayed with the stop code MANUALLY_INITIATED_CRASH and a memory dump will be performed.
4.2 Dump initiated manually by the debugger
The memory dump is performed as a result of entering the debugger command
.crash
4.3 Dump initiated by error enforcement
The memory dump is performed as a result of the intended execution of the program leading to an error in the operating system.
To force an error and perform a memory dump:
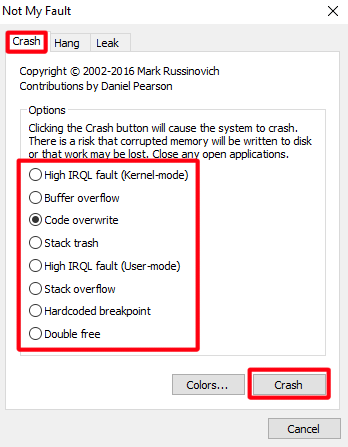
Run the program Not My Fault included in the Sysinternals package.
In the
Crashtab, select the reason for the error.Select the
Crashbutton. After a while, the BSOD will be displayed with the associated stop code (e.g.ATTEMPTED_WRITE_TO_READONLY_MEMORY) and a memory dump will be made.
4.4 Dump initiated by error
Memory dump is performed without user intervention when Windows stops working correctly.
5. Basic crash dump analysis
To perform a basic (initial) crash dump analysis:
- Launch:
a) WinDBG located at C:\Program Files (x86)\Windows Kits\10\Debuggers\x64\windbg.exe
b) or the cdb.exe command line tool:
C:\> "C:\Program Files (x86)\Windows Kits\10\Debuggers\x64\cdb.exe" -Z [DMP_FILE]
e.g.
C:\> "C:\Program Files (x86)\Windows Kits\10\Debuggers\x64\cdb.exe" -z Z:\Mem\MEMORY.DMP
- Select ‘Open Crash Dump’ from File menu.
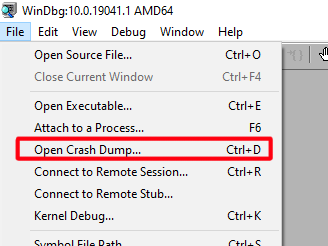
Select the file containing the crash dump and select the ‘Open’ button.
After loading the file by WinDbg or cdb.exe you should see the log:
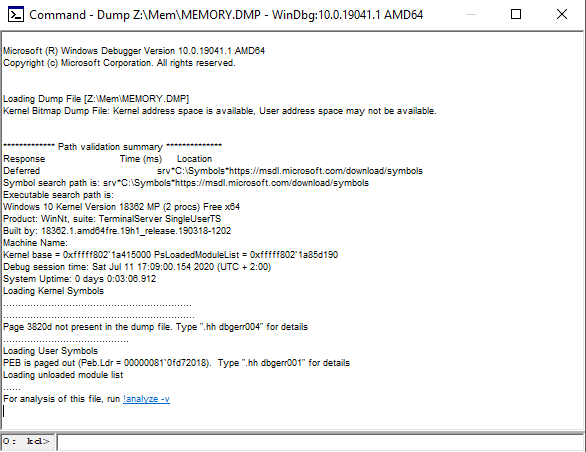
The log of loading the file contains information about:
- address space available for analysis,
- operating system version,
- number of logical processors,
- processor architecture,
- date and time when crash dump was made,
- the time that has elapsed since the operating system was started,
- current logic processor number.
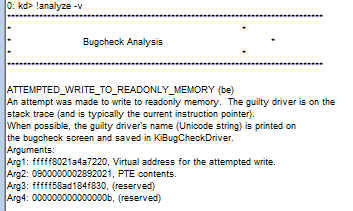
- Run the command:
!analyze -v
After executing the command, information about the type of error that occurred and a hint on how to analyze it will be printed.
Below it will be the call stack that led to the dump, and directly indicate the module where the error occurred.
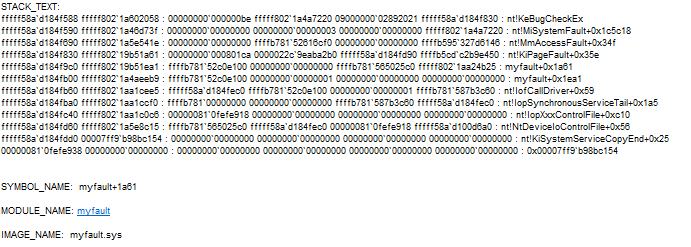
From the sample logs it is known that the myfault module is a problem.
- More information about the
myfaultmodule can be obtained by entering the command:
lmvm myfault
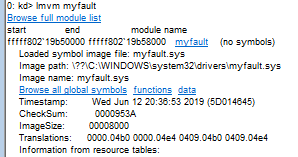
As a result of the command, a number of basic properties of the myfault module were obtained. One of them is the path to the executable file C:\WINDOWS\system32\drivers\myfault.sys. In this way, a specific Portable Executable file was identified, which when launched causes an unrecoverable error in the OS.
6. Summary
The methods and tools for analyzing memory dump presented in the article allow you to perform basic analysis to identify the OS module responsible for the occurrence of an unrecoverable error in this system. Presented ways to configure the operating system components allow you to enter your own settings for creating and managing memory dumps.